rlist
rlist is a set of tools for working with list objects. Its goal is to make it easier to work with lists by providing a wide range of functions on non-tabular data stored in them.
Its design is very much like dplyr but rlist is focused at dealing with non-tabular data stored in JSON or YAML format which can be easily represented by list objects in R.
In this example, we will get to know more about Hadley Wickham's contribution to R community from JSON data retrieved with GitHub API using rlist and pipeR.
library(pipeR)
library(rlist) # devtools::install_github("rlist","renkun-ken")
repos <- "https://api.github.com/users/hadley/repos?per_page=100&page=%d" %>>%
  sprintf(1:2) %>>%
  list.load("json") %>>%
  list.ungroup
We have retrieved all the repositories of Hadley Wickham and put them into a list called repos. It includes rich information and can be fun to explore with. To know better about the data structure, visit this page and you will get an impression on how the data is structured.
First, let's see the main languages of the repositories.
repos %>>%
  list.table(language) %>>%
  list.sort(-.)
# language
#          R       <NA>        C++ JavaScript          C        TeX
#         95         13          9          8          6          5
#       Ruby      Shell       HTML     Python      Rebol        CSS
#          3          3          2          2          2          1
#     Turing
#          1
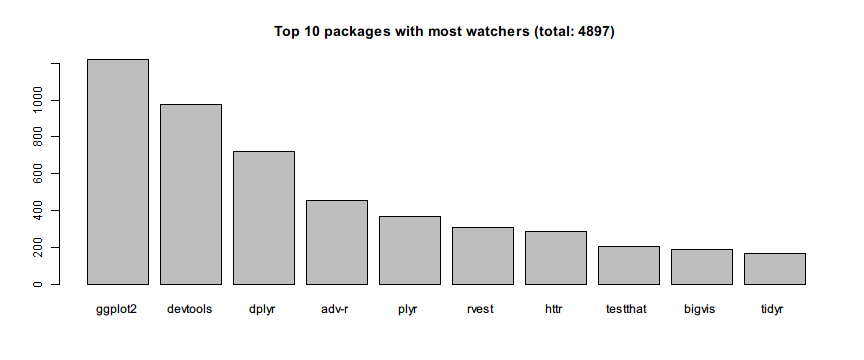
It is not surprising that most repo's main language is R. Then we can build a much longer pipeline to show the mostly watched active repos. Here we regard the repos updated in the last 30 days as active.
repos %>>%
  list.update(updated_at = updated_at %>>%
      strptime("%Y-%m-%dT%H:%M:%SZ")) %>>%
  list.filter(updated_at >= as.POSIXct(Sys.Date() - 30)) %>>%
  (~ active_repos) %>>%
  list.sort(-watchers) %>>%
  list.take(10) %>>%
  list.select(name, watchers) %>>%
  list.stack %>>%
  (~ most_watched_repos) %>>%
  with(
    barplot(watchers,names.arg = name,
      main = "Top 10 packages with most watchers (total: %d)" %>>%
        sprintf(sum(watchers)))
    )

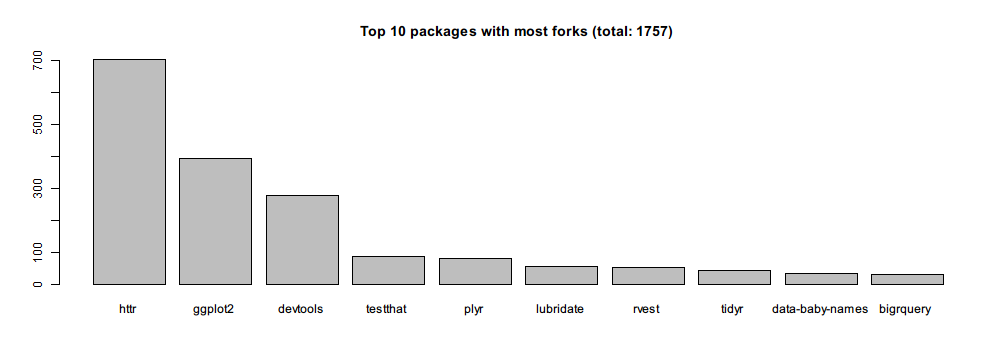
Then we can use similar way to see repos mainly written in R with most forks. Note that in the previous code, we save the filtered results to active_repos for further use so that we don't have to transform the data every time.
active_repos %>>%
  list.filter(language == "R") %>>%
  list.sort(-forks) %>>%
  list.take(10) %>>%
  list.select(name, forks) %>>%
  list.stack %>>%
  with(
    barplot(forks,names.arg = name,
      main = "Top 10 packages with most forks (total: %d)" %>>%
        sprintf(sum(forks)))
    )

We are also interested in the repos whose name contains plot or vis. Let's see what they are arranged by popularity measured in count of stargazers.
repos %>>%
  list.filter(!fork) %>>%
  list.filter(grepl("plot|vis", name)) %>>%
  list.sort(-stargazers_count) %>>%
  list.mapv(name)
#  [1] "ggplot2"         "bigvis"          "ggplot2-book"
#  [4] "productplots"    "boxplots-paper"  "lvplot"
#  [7] "bigvis-infovis"  "densityvis"      "ggplot2-bayarea"
# [10] "toc-vis"         "lvplot-paper"    "prodplotpaper"
# [13] "ggplot2-docs"    "vis-migration"   "imvisoned"
If you don't know much about Hadley's repos and heard a repo that sounds like player, you can filter the names by fuzzy searching using soundex measurement provided by stringdist.
repos %>>%
  list.filter(!fork) %>>%
  list.filter(stringdist::stringdist("player", name, method = "soundex") == 0L) %>>%
  list.mapv(name)
# [1] "plyr"
Now we know that package is actually spelled as plyr.